Sales report
The Sales Report shows how your bookings sell over any period: revenue, refunds, discounts, taxes, payments still due, guests, booking lead time, length of stay.
The add-on adds a new BA Book Everything → Sales Report sub-menu under your booking object admin menu.
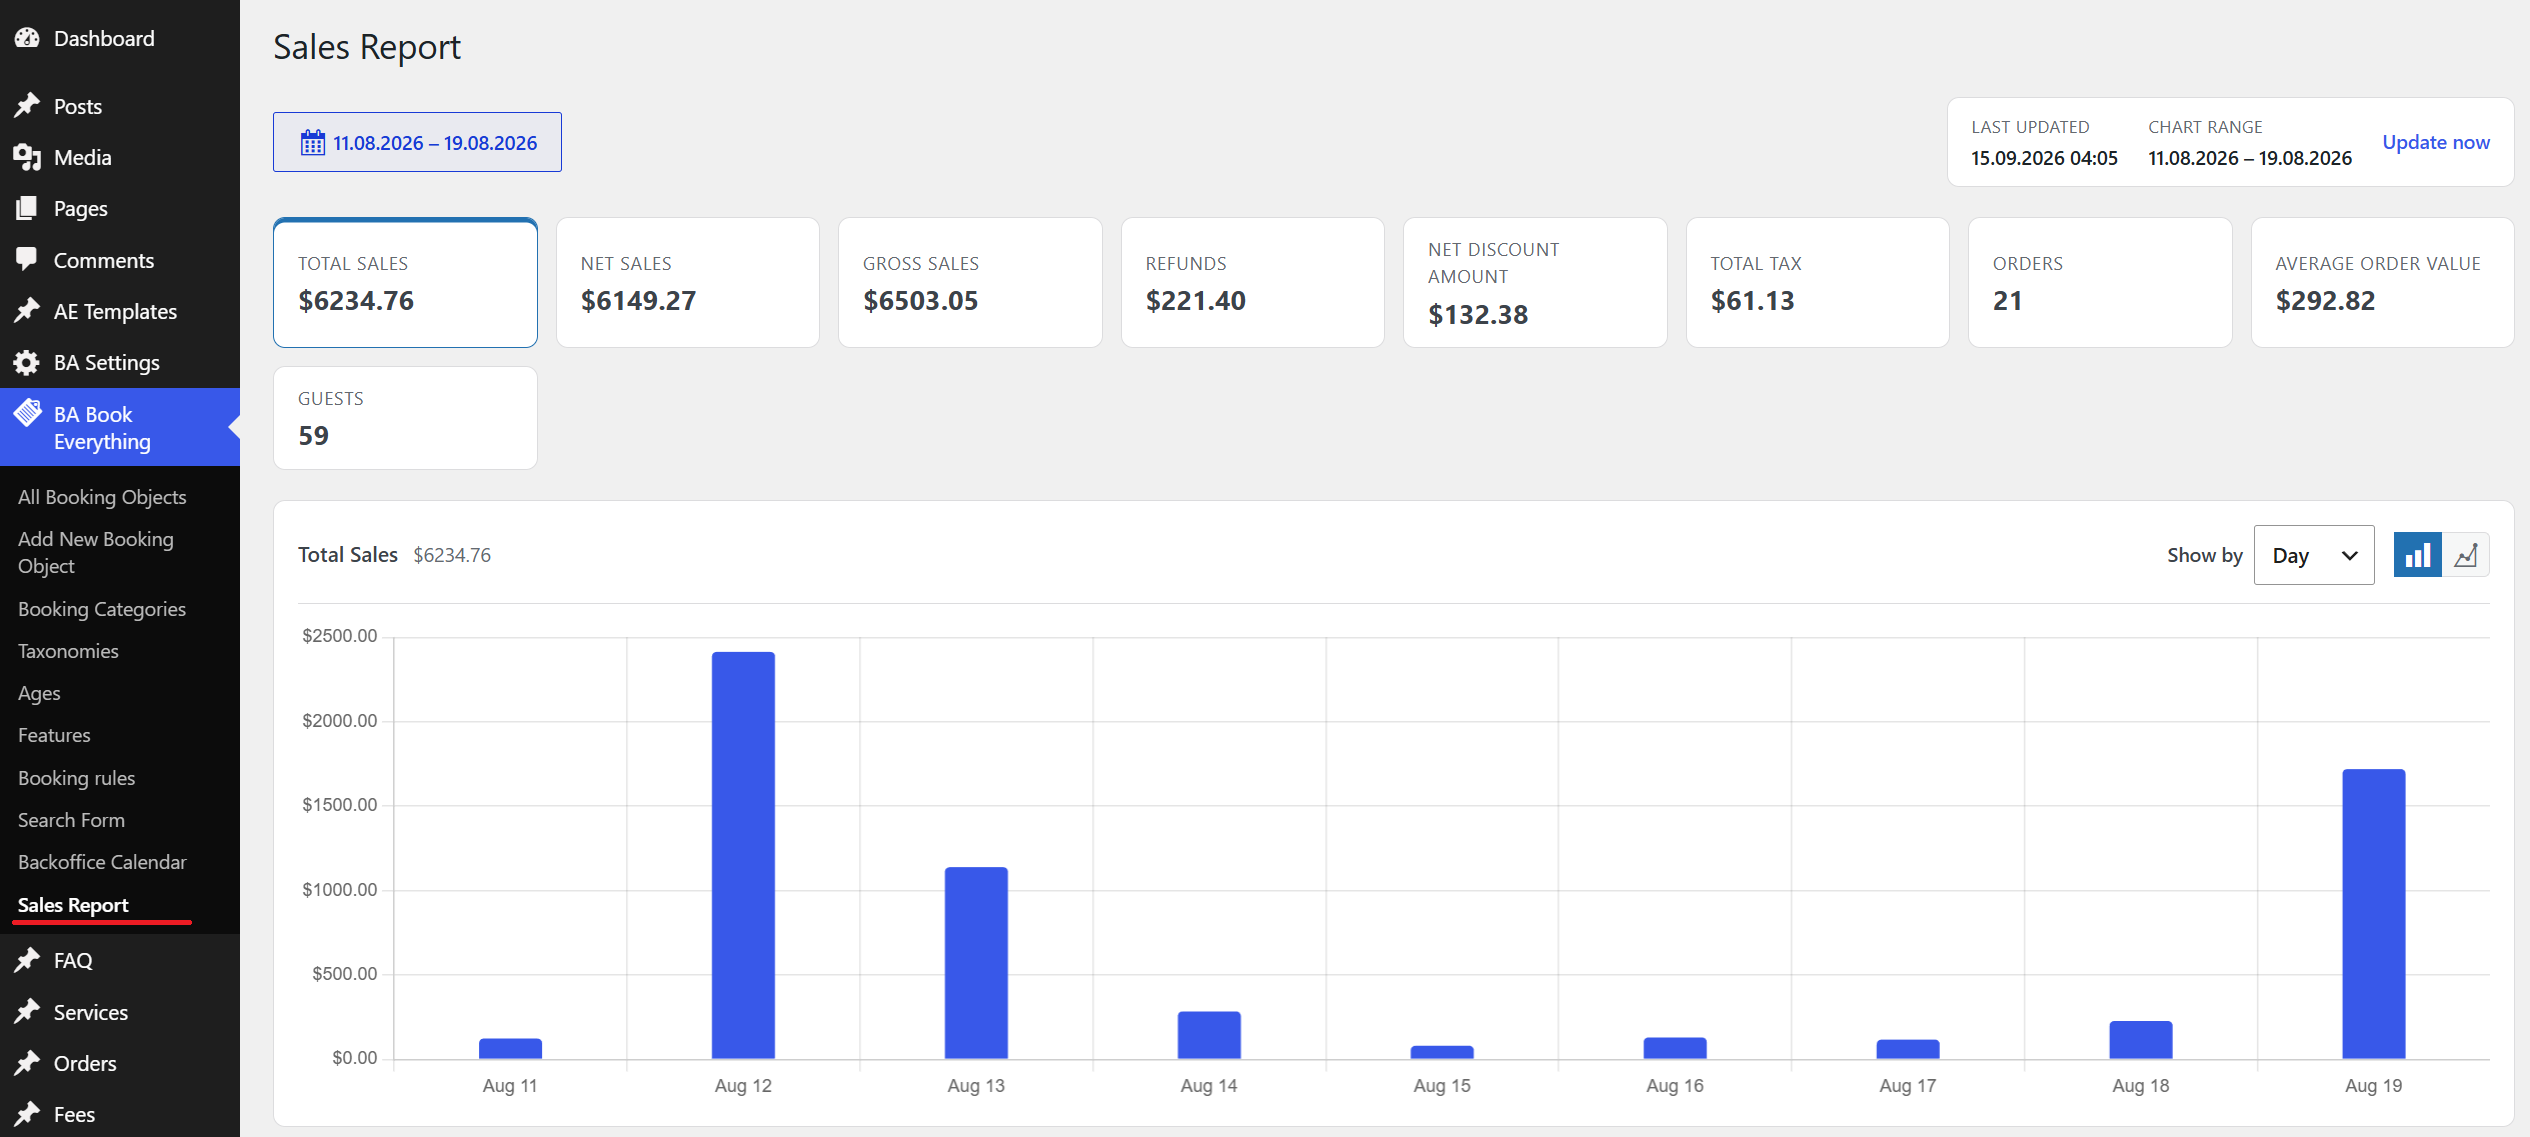
The report page consists of the following blocks, from top to bottom:
- Period selector and data status — which dates the report covers
- KPI tiles — key figures for the whole period
- Chart — how the selected figure changed by day, week or month
- Breakdown table — the same figures as a table, with CSV download
- Summary bar — days, orders and Total Sales of the period
- Occupancy — how much of the available capacity was booked
The Sales Report menu is shown only when the BABE Backoffice license is active. The report is available to users who can manage site options (the Administrator role by default).
How orders are counted
Read this section first: it explains most of the questions like "why does this number differ from what I expected".
Order date
All figures, except Occupancy, are grouped by the date the order was placed, not by the booking start date. Dates are taken in the site time zone set in Settings → General.
For example, a booking made on March 3 for a stay in July is counted in March.
Current order status
The report always uses the current order status. If an order placed last month is canceled or refunded today, last month's figures change the next time the report is opened. The refund is also counted on the date the order was placed, not on the date of the refund.
Order statuses
Each figure takes into account only orders with certain statuses:
- Sales orders — payment authorized, payment received, completed. Used for almost all figures: sales, taxes, discounts, payments, guests and stays
- Canceled orders — canceled. Used for Cancelled Orders and Cancelled Orders, %
- Placed orders — all statuses except draft and not available: availability confirmation, customer confirmation, payment deferred, payment expected, payment processing, payment authorized, payment received, canceled, completed. Used for Refunds and Cancelled Orders, %
Orders in the payment expected, payment deferred, payment processing, availability confirmation and customer confirmation statuses are not sales yet. They are not added to revenue, guests or any other sales figure, and are counted only as placed orders for the cancellation rate.
Carts (draft) and orders that failed the availability check (not available) are never counted.
Currency
The report does not convert currencies. All amounts are summed as they are stored in orders and displayed in the site default currency, using the format from the BA Settings → Currency admin menu (symbol position, decimal and thousands separators, number of decimals).
Selecting a period
The toolbar at the top of the page selects the period and shows when the figures were calculated.
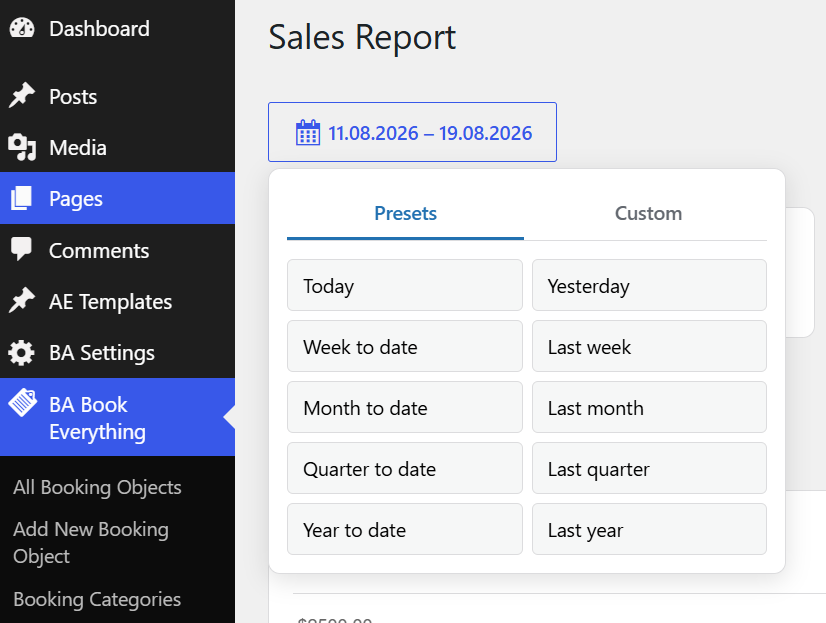
Click the button with the calendar icon (it shows the name of the current period) to open the period panel. The panel has two tabs: Presets and Custom.
Presets
Click a preset to apply it immediately:
- Today — the current day
- Yesterday — the previous day
- Week to date — from the first day of the current week to today. The first day of the week is taken from the Settings → General → Week Starts On option
- Last week — the whole previous week (7 days)
- Month to date — from the 1st day of the current month to today. This is the default period when the report is opened
- Last month — the whole previous calendar month
- Quarter to date — from the first day of the current calendar quarter (January 1, April 1, July 1 or October 1) to today
- Last quarter — the whole previous calendar quarter
- Year to date — from January 1 of the current year to today
- Last year — the whole previous calendar year
"Today" is determined by the site time zone, not by the time on your computer.
Custom range
- From — the first day of the period (included)
- To — the last day of the period (included)
- Update — apply the range
If the dates are entered in reverse order, the report swaps them. If a date is empty or invalid, the last 30 days (including today) are used.
Data status
On the right side of the toolbar:
- Last updated — the date and time the figures were calculated. The report does not cache data: the figures are recalculated from orders every time the page is loaded
- Chart range — the exact dates of the selected period (useful for presets like Last quarter)
- Update now — reload the page and recalculate the figures, keeping all current settings (period, chart, rows per page)
The period, the charted figure, the chart type, the interval and the rows per page are kept in the page URL. You can bookmark the page or send the link to another administrator to open exactly the same view. The only exception is the columns of the breakdown table — they are saved per user (see Choosing columns)
KPI tiles
The row of tiles under the toolbar shows the key figures for the whole selected period:
- Total Sales — order totals (with taxes, fees and gateway fees, after coupons and points) minus refunds
- Net Sales — the price of sold bookings and services before taxes, minus refunds and coupons
- Gross Sales — the price of sold bookings and services before taxes, fees and coupons
- Refunds — all money refunded, including refunds on canceled orders
- Net Discount Amount — coupon discounts
- Total Tax — taxes on bookings and services
- Orders — the number of sales orders
- Average Order Value — Net Sales per order
- Guests — the number of guests in sold bookings
Each figure is described in detail in the Metrics section.
Click a tile to show its figure on the chart. The selected tile is highlighted. Total Sales is selected by default.
Chart
The chart shows how the figure of the selected tile changed over the period.
- Header — the name of the charted figure and its total for the period (the same value as on the tile)
- Show by — the size of one bar or point of the chart:
- Day — one bar per day (default)
- Week — one bar per week. Weeks start on the day set in the Settings → General → Week Starts On option
- Month — one bar per calendar month
- Bar chart / Line chart buttons — the chart type. Bar chart is the default
The first and the last week or month can be partial when the period starts or ends in the middle of it. Days without orders are shown as zero, so the chart has no gaps. Hover over a bar or point to see its exact value.
For averages (such as Average Order Value) each bar is calculated from all orders of that day, week or month, not as an average of daily values
Breakdown table
The Breakdown table shows the figures for each day, week or month of the period, according to the Show by option of the chart.
- Date — the date of the row. For weeks and months it is the range of dates the row covers, e.g. 01.08.2026 – 07.08.2026
- Other columns — the figures you selected (see Choosing columns)
The newest rows are shown first. A day without orders is shown as a row of zeros.
Choosing columns
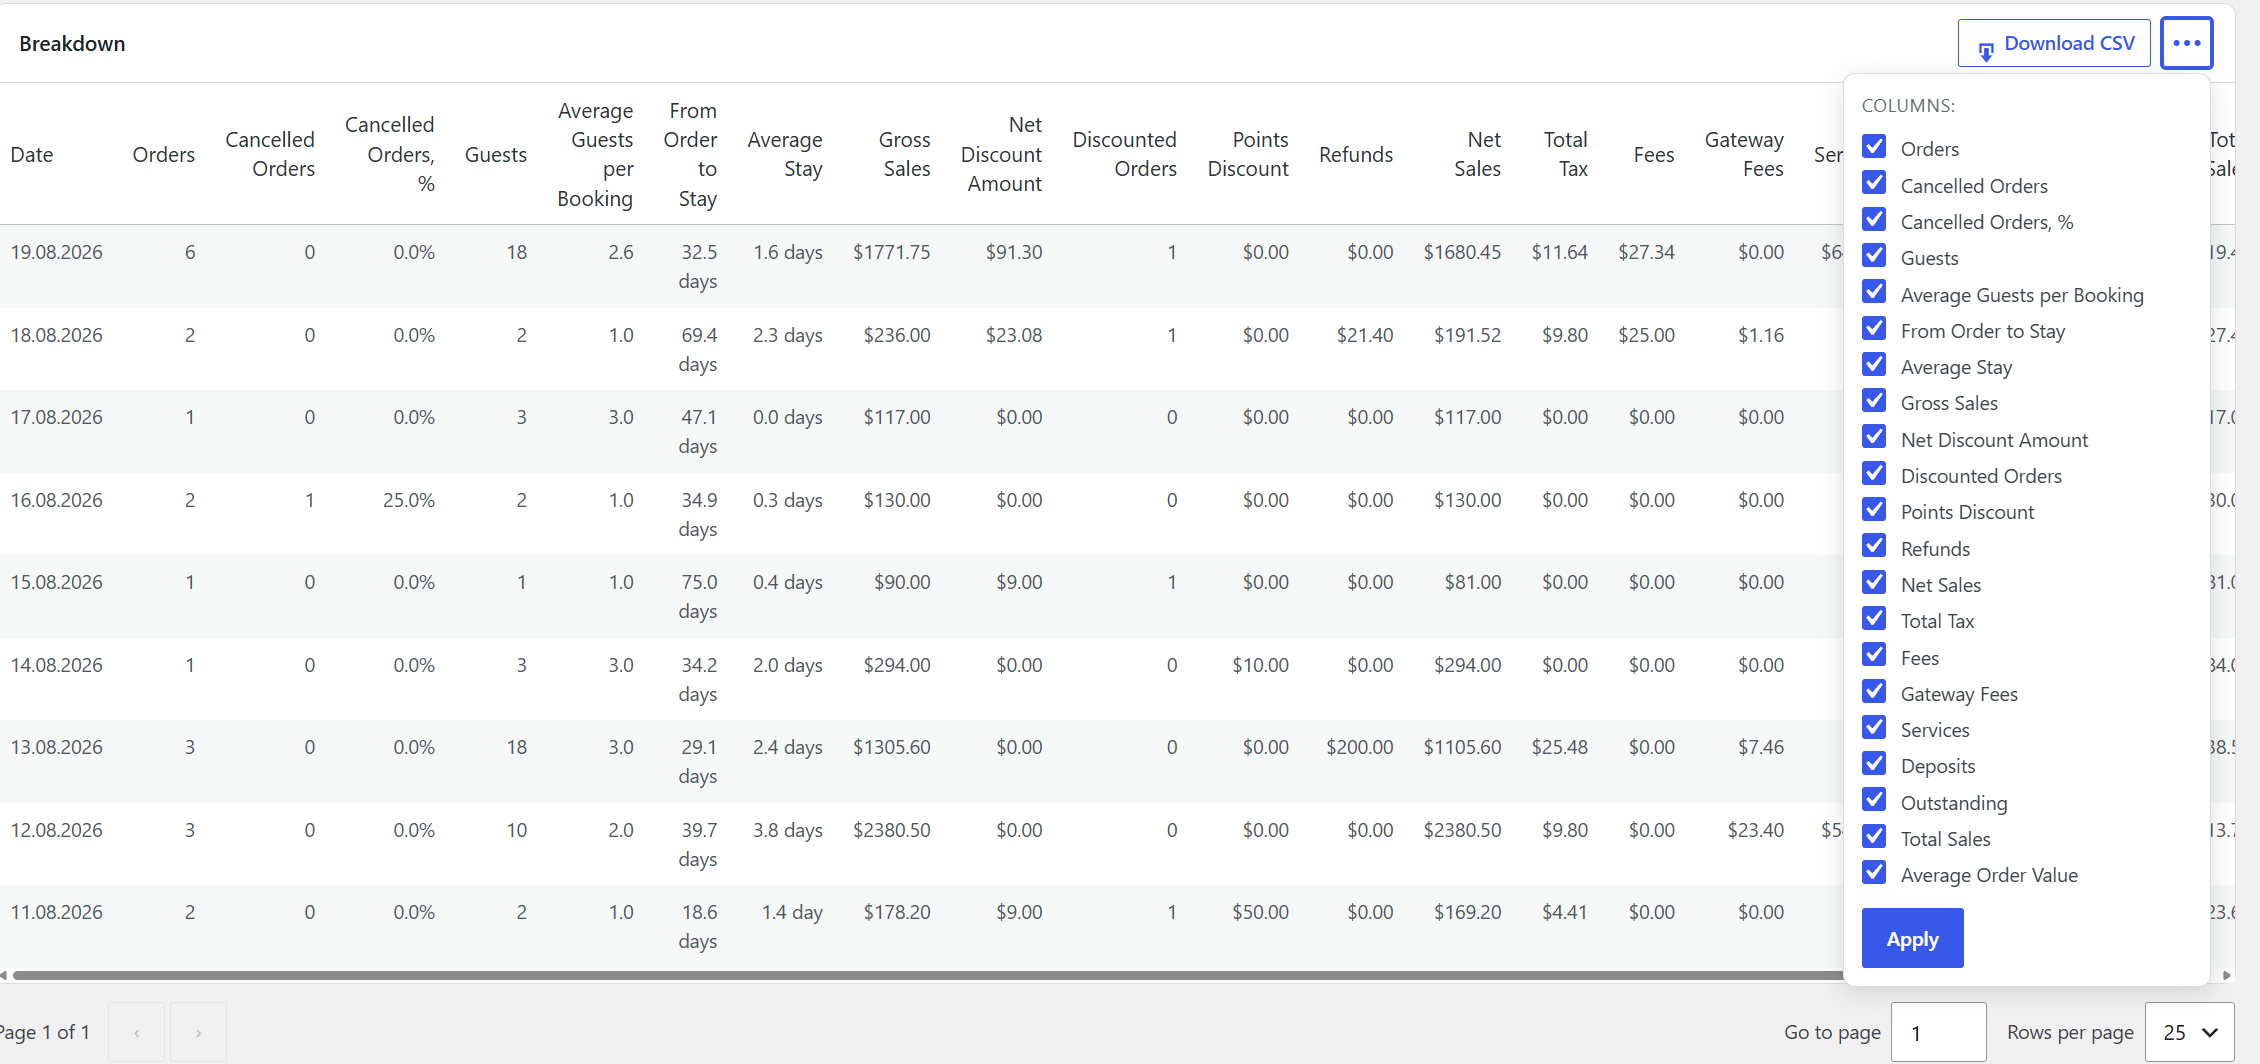
Click the ⋯ (Choose columns) button in the table header, check the columns you need and click the Apply button.
- All 21 figures from the Metrics section are available. By default 8 columns are shown: Orders, Guests, Gross Sales, Net Discount Amount, Refunds, Net Sales, Total Tax, Total Sales
- Columns are always shown in the same order, whatever order you check them in
- The selection is saved for your user account: it is kept when you change the period, switch pages or open the report later. Other administrators have their own selection
- If all columns are unchecked, the table shows only the Date column
Pagination
The pagination is located under the table:
- Page X of Y — the current page and the total number of pages
- ‹ › — the previous and the next page
- Go to page — type a page number and press Enter
- Rows per page — 10, 25 (default), 50 or 100 rows
If the selected page no longer exists (for example, after selecting a shorter period), the last page is shown.
Download CSV
The Download CSV button in the table header downloads the breakdown table as a .csv file for Excel, Google Sheets or accounting software.
- File name —
sales-report_<first day>_<last day>.csv, e.g.sales-report_2026-08-01_2026-08-31.csv - Rows — all rows of the period, not only the current page. Rows follow the Show by option (days, weeks or months) and go newest first, as in the table
- Columns — Date and the columns selected in the table
- Units — are added to the column headers:
Gross Sales (USD),Cancelled Orders, % (%),Average Stay (days). Counts have no unit - Numbers — without currency symbols and thousands separators, with a dot as the decimal separator (
1234.50), so the spreadsheet reads them as numbers. Money has as many decimals as set in the currency settings; percentages, averages and days have one decimal - Encoding — UTF-8, Excel opens it without extra settings
- Separator — comma
With some regional settings Excel expects a semicolon as the separator. In this case open the file with Data → From Text/CSV and select Comma as the delimiter
A text cell that starts with =, +, - or @ is written with a leading apostrophe, so a spreadsheet never runs it as a formula
Summary bar
The line under the table sums up the period:
- days — the number of days in the selected period (including days without orders)
- orders — the number of sales orders (the same as the Orders tile)
- Total Sales — the same as the Total Sales tile
Metrics
All 21 figures available in the breakdown table. For each figure it is noted which order statuses it takes into account.
Money
- Gross Sales — the price of the booked items and their services before taxes. Sales orders
- Includes the booking object's own discount set in the booking object prices
- Does not include taxes, fees, payment gateway fees, coupons, points discounts and refunds
- Calculated from the prices saved in each order item, the same way the order total is calculated
- Services — the price of the services added to bookings, before taxes. Sales orders
- This amount is already included in Gross Sales: the column shows which part of Gross Sales comes from services. Do not add it to Gross Sales
- Total Tax — taxes charged on booked items and services. Sales orders
- The tax rate is set in the booking category of the booking object
- Fees — additional fees added to bookings (e.g. a cleaning fee). Sales orders
- Fees are not part of Gross Sales, but are part of Total Sales
- On most sites without fees this column is
0, so it has no tile
- Gateway Fees — fees added to orders by payment methods that charge the customer a percentage. Sales orders
- Calculated from the order amount after coupons and points
- Net Discount Amount — the total of coupon discounts applied to orders. Sales orders
- Does not include the booking object's own discount (it is already in the price, see Gross Sales) and points discounts (see Points Discount)
- Points Discount — the amount paid with loyalty points. Sales orders
- Informational figure: it is not subtracted in Net Sales
- Refunds — all money refunded to customers, full and partial. Placed orders
- Unlike other figures, it includes canceled orders: a full refund usually cancels the order, and without canceled orders most refunds would be missing
- That is why Refunds can be bigger than the refund amount subtracted in Net Sales (see How money figures relate)
- Refunds are made on the order page, see Editing & refunding orders
- Net Sales — what you earned from bookings and services, before taxes and fees, after refunds and coupons. Sales orders
- Net Sales = Gross Sales − refunds on sales orders − Net Discount Amount
- Only refunds of sales orders are subtracted: a canceled order is not in Gross Sales, so subtracting its refund would count it twice
- Total Sales — the full amount customers pay for orders, minus refunds. Sales orders
- Total Sales = order totals − refunds on sales orders
- The order total includes items, services, taxes, fees and gateway fees, and is reduced by coupons and points
- Average Order Value — the average value of one order. Sales orders
- Average Order Value = Net Sales ÷ Orders
- Based on Net Sales, so taxes and fees do not make orders look bigger
- Deposits — all money received on orders: deposits and full payments. Sales orders
- Not reduced by refunds
- Outstanding — money still to be received from customers, e.g. the balance of orders paid by deposit. Sales orders
- Outstanding = order totals − Deposits
- Refunds do not change it
Orders
- Orders — the number of orders in the payment authorized, payment received and completed statuses. Sales orders
- One order can contain several bookings (see Average Guests per Booking)
- Cancelled Orders — the number of orders in the canceled status. Canceled orders
- Cancelled Orders, % — the share of canceled orders among all placed orders. Placed orders
- Cancelled Orders, % = Cancelled Orders ÷ placed orders × 100
- Placed orders include orders still waiting for payment or confirmation, so the rate is not overstated
- Discounted Orders — the number of orders with a coupon applied. Sales orders
- Only coupons are counted: orders paid with points or with the booking object's own discount are not counted
Guests and stays
- Guests — the total number of guests in all bookings of the orders, all age categories together. Sales orders
- In the Object booking mode it is the number of guests entered in the booking, not the capacity of the object
- Average Guests per Booking — the average number of guests in one booking. Sales orders
- Average Guests per Booking = Guests ÷ bookings
- A booking is one booked item of an order. An order with two rooms has two bookings
- From Order to Stay — how many days in advance customers book: the average time from placing the order to the start of the booking. Sales orders
- Calculated with the time of day, so it is shown with one decimal (e.g. 12.4 days)
- A low value means last-minute bookings, a high value means early bookings
- Average Stay — the average length of a booking in days, from the start date to the end date. Sales orders
- Bookings within one day, such as tours or hourly rentals, count as
0or a part of a day
- Bookings within one day, such as tours or hourly rentals, count as
All averages and percentages (Average Order Value, Cancelled Orders %, Average Guests per Booking, From Order to Stay, Average Stay) are calculated from all orders of the row or period, not as an average of daily values. A day with one order and a day with ten orders do not weigh the same
How money figures relate
Example: one order in the payment received status.
| Amount | |
|---|---|
| Booking price (after the object's own discount) | 200.00 |
| Service | 50.00 |
| Gross Sales | 250.00 |
| Tax 10% on booking and service → Total Tax | 25.00 |
| Cleaning fee → Fees | 30.00 |
| Coupon → Net Discount Amount | −20.00 |
| Paid with points → Points Discount | −10.00 |
| Payment gateway fee 2% of 275.00 → Gateway Fees | 5.50 |
| Order total | 280.50 |
The customer paid a deposit of 100.00, later a partial refund of 50.00 was made. The order stays in the payment received status.
| Figure | Calculation | Value |
|---|---|---|
| Gross Sales | booking + service | 250.00 |
| Refunds | 50.00 | |
| Net Sales | 250.00 − 50.00 − 20.00 | 180.00 |
| Total Sales | 280.50 − 50.00 | 230.50 |
| Deposits | received | 100.00 |
| Outstanding | 280.50 − 100.00 | 180.50 |
| Average Order Value | 180.00 ÷ 1 order | 180.00 |
If the same order were canceled with a full refund, it would drop out of all figures except Refunds and Cancelled Orders.
The Refunds tile includes refunds on canceled orders, while Net Sales subtracts only refunds on sales orders. The two are equal only when there are no refunded canceled orders in the period
Occupancy

The Occupancy table shows how much of the capacity you offered was booked in the selected period.
Unlike the rest of the report, occupancy is calculated by stay dates — the days (or hours) when guests use the booking object. For the period August 1 – 31 it shows how full the objects are in August, whenever the bookings were made. The note next to the table title shows the period
The table has one row per booking object, the fullest objects first:
- Booking object — the name of the booking object
- Capacity — the capacity offered in the period: the sum of places over all available slots. A slot is a day for daily booking objects and an hour for hourly ones. Days or hours closed in the schedule are not counted, since capacity that was never offered is not unsold capacity
- Booked — how much of this capacity is booked
- Occupancy Rate — Booked ÷ Capacity × 100
- Total — the sums of Capacity and Booked for all objects and the overall rate
The meaning of the numbers depends on the booking mode set in the booking rules of the object:
- Places booking / Tickets booking — capacity is the number of places per slot, booked is the number of guests. For example, a tour for 20 people with 15 guests on one day: Capacity 20, Booked 15, 75%
- Object booking — each booking takes the whole slot, whatever the number of guests. For example, an apartment for 4 people booked by 2 guests for 3 nights: Capacity 12, Booked 12, 100%
- Occupancy Rate above 100% means a slot was overbooked. The value is not limited on purpose, so you can find such cases
- The Total row sums slots of all types together: an hour of an hourly object counts the same as a night of a daily one. It answers "how much of what was offered got booked", not "how full the property was"
- Only published booking objects with an availability calendar in the period are listed. If nothing was available, the table shows No availability data for the selected period
- Occupancy is taken from the availability calendar as it is at the moment you open the report, not from the order statuses used in the rest of the report
For developers
The order status lists can be changed with filters. Each filter receives and returns an array of order status keys:
babe_report_sale_statuses— sales orders. Default:payment_authorized,payment_received,completedbabe_report_canceled_statuses— canceled orders. Default:canceledbabe_report_placed_statuses— placed orders. Default: all order statuses exceptdraftandnot_available
add_filter( 'babe_report_sale_statuses', function ( $statuses ) {
    $statuses[] = 'payment_deferred';
    return $statuses;
} );
Sales and canceled statuses should also be in the placed statuses list. An order with a status outside the placed list is skipped by the order totals, but still counts in the booking-based figures (Gross Sales, Total Tax, Guests, etc.), so the figures would not match